- Attributes of each trial:
- [iArtifacts]: if the current trial is considered as a "bad" trial due to artifacts, ∈ (0: good trial; 1: bad)
- [iTrialType]: trial type {1,2,3,4,-1}
- [iInstructionLength]: length of the instruction period, ∈(100:1000 ms), source: presentation log 5xxx.
- [iOffIndex]: the block index number for current trials's light off in eegData02, ∈(1:191)
- [iOffOffset]: the offset index number for current trials's light off in each block in eegData02, ∈ (1:12500)
- [iOnIndex]: the block index number for current trials's light on in eegData02, ∈(1:191)
- [iOnOffset]: the offset index number for current trials's light on in each block in eegData02, ∈ (1:12500)
- Attributes with respect to the raw markers (markerData(1, x).trial & time)
- [lightOnTimeClean]: clean events of light on events (with double trigger events manually removed)
- [lightOnCleanIndex]: index of clean events in the originally markers -- gData.markerData(1,1).trial
- [lightOffTimeClean]: clean events of light off events (with double trigger events manually removed)
- [lightOffCleanIndex]: index of clean events in the originally markers -- gData.markerData(1,2).trial
- EEG channel working data
- [eegData02]: EEG working data. {Column 1: left&Right. Column2: up&down. Column3: info channel}
- Column3 info channel data format: [condition].[iTrialtype] e.g. 54.1 = light off for proleft, 52.3 = light on for antileft

Tuesday, December 6, 2011
data dict
Global var [scannerdata]
Sunday, December 4, 2011
MEGANTI - Preprocessing
[Presentation sce file]
In total 14 blocks, each block has 80 trials, each trial has following four events recorded in the log file:
Subjects
SW - [2010-08-11] - Old system no parallel code
raw: S02_MEG54_VEF_02.ds
stim log (raw): sw32-110810-SO2-Pro+Anti-saccade task.log
Problems in the data:
In total 14 blocks, each block has 80 trials, each trial has following four events recorded in the log file:
- [Start]: duration 1000 ms, code 0, port_code 1
- [Pro] or [Anti] initiation: LightOn, (green pro, red anti) duration 100 ms, code 54, port_code 54,
- [pro5xxx] or [anti5xxx]: randomized length, code: 5+ [100:50:1000], e.g. 5100, 5250..., port_code [101:1:117]
- [GO cue ∈ 1 | 2 | 3 | 4] : duration 20 ms, LightOff
- 1: greyboxproleft, port_code 201 -- prostim left
- 2 :greyboxproright, port_code 202 -- prostim right
- 3: greyboxantileft, port_code 203 -- antistim left
- 4: greyboxantiright, port_code 204 - -- antistim right
Subjects
SW - [2010-08-11] - Old system no parallel code
raw: S02_MEG54_VEF_02.ds
stim log (raw): sw32-110810-SO2-Pro+Anti-saccade task.log
Problems in the data:
- The stim log has 195 missing event condition, all replaced with -1.
- The lightOn marker has 130 extra double triggers - fixed (lightOnTimeClean:1121)
- The lightOff marker has 3 extra double triggers - fixed (lightOffTimeClean:1120)
- Verify by comparing the time diff between on and off with the event code, 121.40
Saturday, October 15, 2011
re: Thesis Overview
TASK RELATED NEUROMAGNETIC ACTIVITY UNDERLYING THE VISUAL PERCEPTION OF VELOCITY CHANGE: A MEG STUDY
Supervisor: Dr. JFX DeSouza (link)
MEG Analyses Mentor: Dr. P Ferrari
Research questions
Supervisor: Dr. JFX DeSouza (link)
MEG Analyses Mentor: Dr. P Ferrari
Research questions
Part 1: Motion perception (fast & slow moving dots)
- Is there different cortical representation for fast & slow motion?
- Are there different temporal dynamics for fast & slow motion?
Part 2: Decision-making
- Subjects need to detect a change in the motion velocity and respond with button press
- When and where in the brain is a visual perception (velocity change) transformed into the neural signals for action?
Experiment
- Prior to the imaging sessions, I conducted a perceptual thresholds test (N=22) to acquire the minimal detectable increase and decrease in motion velocity for the subjects
- I set up the experimental environment and collected MEG & MRI data (N=12) with the helps from S. Bells and M. Lalancette at Toronto Sickkids hospital.
- Velocity change in the experiment was set according to each subject's perceptual thresholds, so the correct and incorrect responses could be compared
- A delayed motor response paradigm was used to separate decision-making signals from motor related signals.

Analyses

Results
Part 1 - Motion Perception
No difference in the MT+ locations (Talairach) for fast and slow motion was found (Hotelling's T2 for two multivariate independent samples)
Fig - MT+ locationsFig - comparing the MT+ locations with previous studies
No temporal dynamics for source peak amplitude and latency found
- Velocity and visual display had no effects (3-way ANOVA)
- The amplitude and latency btw the three ROIs were different (P<.05)
- Multiple-comparison showed cuneus had higher amplitude & earlier latency than V3A & MT+

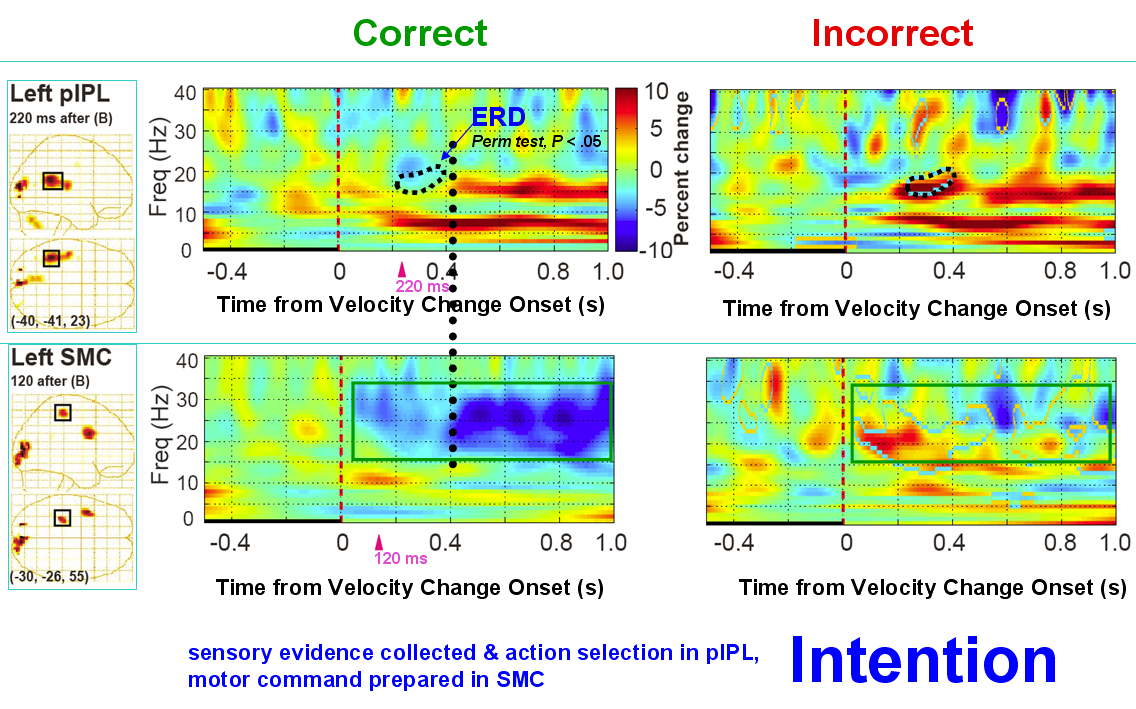
Part 2 - Decision-making
Comparing the grand average event-related beamformer images:
- In the correct responses, the frontoparietal sources were observed at various time points after the velocity change onset (left column, perm-test, P<.05)
- No significant frontoparietal activations were observed in the incorrect responses (right column)

Comparing the time-frequency plots for correct and incorrect responses from IPL and SMC sources:
- IPL source showed a beta power difference between correct and incorrect responses from 200 - 400 ms (area encircled in dotted line)
- The initiation of IPL beta ERS was aligned with the high beta ERD increase in SMC after 400 ms (dotted line)
Friday, May 27, 2011


Problem: # 12 subject
sub#12 has noisy sensor data, but the beamformer reported good MT activation.


Scatter plot: outlier sub#12 is in the black box


When sub#12 is excluded :


(-30 -68 1)

(-35 -66 -3)


Other subjects' RMS can be found here
Scatter plot: outlier sub#12 is in the black box


When sub#12 is excluded :

Individual virtual sensor time course at MT+, please look at sub#12:
Left Fast

Left Slow

Right Fast

Right Slow

Cuneus
Left Fast

Left Slow

Right Fast

Right Fast

Sunday, May 22, 2011
Monday, May 16, 2011
Glassbrain movies
[A001] Aligned to [motion stimulus] onset
All movies are made with neurological orientation in Tal coordinates from onset (0 ms) of visual stim to 500 ms after onset.
AB
AK
CM
Left_Fast: weak MT+
DA
Left_Fast: interesting, contraL cuneus -> contraL V3A -> ipsiL MT+ -> contraL MT+
ES
JD
Left_Fast:contraL MT+ then moved to ipsiL MT+
PD
Left_Fast: V3A prior to V1 activation
SL
ST (this subject had no strong V3A activation)
SW
Right_Slow
SX
WW
Left_Fast: V3A prior to cuneus
[B002] Group avg for velocity change onset
[A002] Group avg for GO cue onset
[C] Group avg for button press
Incorrect response
Saturday, May 14, 2011
Individual RMS plots for 9 out of the total 12 subjects
Bandpass: 1-30Hz
Motion stim onset: 0 s
In each subject, the first plot is left visual display and second plot is for right.
Subject: AB


There are two markers for the visual stim: (1) one is synchronized with the onset of the motion stim, (2) The second is synched with the onset of the velocity change, which is not shown here.
Motion stim onset: 0 s
In each subject, the first plot is left visual display and second plot is for right.
Subject: AB


Subject: AK


Subject: CM


Subject: DA


Subject: ES


Subject: JD


Subject: PD


Subject: SW


Subject: SX


Tuesday, May 3, 2011
Wednesday, April 20, 2011
MT+ localization
A001_FastSlow_GetRawData(1, aSubjects, [1 1 1 1], 1, 4, 7)
A001_FastSlow_GetRawData(1, aSubjects, [1 1 1 1], 1, 8, 12)
A001_FastSlow_GetRawData(1, aSubjects, [1 1 1 1], 1, 15, 30)
A001_FastSlow_GetRawData(1, aSubjects, [1 1 1 1], 1, 30, 60)
April 24
A01_FastSlow_assembleRawData()
New function for read data from .mat file and assemble matrix for analysis.
aSubjects = {'AB', 'AK', 'CM', 'DA', 'ES', 'JD', 'PD', 'SL', 'ST', 'SW','SX', 'WW'};
A001_FastSlow_assembleRawData(1, aSubjects)
April 23
New function readTrialsFromRaw()
Added external RMS function: rms.m
Motion localizer figs:
/Users/joseph/data/data/7_SPM2/05_MT_localization/jpg/
function A001_FastSlow_GetRawData(onJoeServer, aSubjects, toDo, doBeamformer)
New function for searching peaks in ctf and do beamformer
aSubjects = {'AB', 'AK', 'CM', 'DA', 'ES', 'JD', 'PD', 'SL', 'ST', 'SW', 'SX', 'WW'};
A001_FastSlow_GetRawData(1, aSubjects, [1 1 1 1], 1)
function A001_FastSlow_MT(aSubjects, toDo, dataHome)
New function for permutation and calculate glass brain for three regions:
primary visual (V1), V3A,and MT+
output:
/Users/joseph/data/data/7_SPM2/04_permutation/A001_MT/
aSubjects = {'AB', 'AK', 'CM', 'DA', 'ES', 'JD', 'PD', 'SL', 'ST', 'SW', 'SX', 'WW'};
A001_FastSlow_MT(aSubjects, [1 0 0 0])
A001_FastSlow_MT(aSubjects, [0 0 1 0])
A001_FastSlow_MT(aSubjects, [0 0 0 1])
A001_FastSlow_MT(aSubjects, [0 1 0 0])
Monday, March 7, 2011
A001 Stimulus onset - Left, right, fast, slow -- collapsed
2010/03/04
(1)Create $Datahome/02_script/03_A001_Combined_ERB_2.5cm run beamformers
IMPORTANT CHANGE!
In dataset that is aligned to the onset of stimulus, there are two folders:
ANALYSIS_A001: stimulus onset
ANALYSIS_A002: velocity onset
(2)normalization for the ERB (A001 correct and err), in matlab run:
Combo_A001_Correct_normlization
Combo_A001_Err_normlization
(3) scripts for ERB permutation
New function, changed the parameters, plot_permutation_tfr_sheng_v2.m
Combo_A001_permute_batch(1,50) % start time, end time, unit 10 ms for correct and error permunation
!!! Check log file after running !!!
(4) permutation threshold, plotting glass brains
D:\MEG\joe\data\7_SPM2\02_averaging\A001_Correct (local)
Saved threshold and max scale in
tCorrectA001.xls ==> tCorrectA001.mat
Server: /Users/joseph/data/data/7_SPM2/02_averaging/A001_Correct/
D:\MEG\joe\data\7_SPM2\02_averaging\A001_Err
tErrA001.xls ==> tErrA001.mat
Server: /Users/joseph/data/data/7_SPM2/02_averaging/A001_Err/
Combo_A001_Correct_glassBrain(1, 50, 1, 1)
Combo_A001_Err_glassBrain(1, 50, 1, 1)
MT+
Gitelman, D. R., A. C. Nobre, et al. (1999). "A large-scale distributed network for covert spatial attention." Brain 122(6): 1093-1106.

Fig. 6 Foci of activations in the temporo-occipital region. Filled circles (d) denote the locations found in the current study. The foci of activations in MT (E, G, C) and an area subserving movement-related knowledge (e) are taken from several previous studies (Zeki et al., 1991; Martin et al., 1995; Beauchamp et al., 1997; Dupont et al., 1997; Chawla et al., 1998).
 Spatiotemporal Activity of a Cortical Network for Processing VisualMotion Revealed by MEG and fMRIAHLFORS
Wednesday, January 26, 2011

TFR data
http://dl.dropbox.com/u/14828654/motionMEG/doc/manuscript/figs.xls
http://dl.dropbox.com/u/14828654/motionMEG/doc/manuscript/ROI_memo_combo.xls
http://dl.dropbox.com/u/14828654/motionMEG/doc/manuscript/ROI_TFR_compare.xls
http://dl.dropbox.com/u/14828654/motionMEG/doc/manuscript/ROI_TFR.xls
Cohen, M. X., K. R. Ridderinkhof, et al. (2008). "Medial frontal cortex and response conflict: Evidence from human intracranial EEG and medial frontal cortex lesion." Brain Research 1238: 127-142.


Peri-response, we also observed enhancements in lower band power(delta) following the desynchronization in the beta band. The pre-response beta and post-response theta changes look related to each other -- need to statistically verify this.


Beta band power difference in preCun pre-stimulu


http://dl.dropbox.com/u/14828654/motionMEG/doc/manuscript/ROI_memo_combo.xls
http://dl.dropbox.com/u/14828654/motionMEG/doc/manuscript/ROI_TFR_compare.xls
http://dl.dropbox.com/u/14828654/motionMEG/doc/manuscript/ROI_TFR.xls
L_ACC/medial frontal G.
Cohen, M. X., K. R. Ridderinkhof, et al. (2008). "Medial frontal cortex and response conflict: Evidence from human intracranial EEG and medial frontal cortex lesion." Brain Research 1238: 127-142.
stimulus on at 0 s, GO cue at 2.2 s,
speed change onset at somewhere around 1 s


key pressed at 0 s

Peri-response, we also observed enhancements in lower band power(delta) following the desynchronization in the beta band. The pre-response beta and post-response theta changes look related to each other -- need to statistically verify this.

L_SMC
Beta oscillation suppressions around motor and supplementary motor regions have been linked to motor preparatory processes (Miller et al., 2007; Neuper et al., 2006; Pfurtscheller et al., 2003) and are thought to reflect decreased global neural coherence during the processing and planning of movements.


L_SMC
Beta band power difference in preCun pre-stimulu


Subscribe to:
Posts (Atom)