TASK RELATED NEUROMAGNETIC ACTIVITY UNDERLYING THE VISUAL PERCEPTION OF VELOCITY CHANGE: A MEG STUDY
Supervisor: Dr. JFX DeSouza (link)
MEG Analyses Mentor: Dr. P Ferrari
Research questions
Supervisor: Dr. JFX DeSouza (link)
MEG Analyses Mentor: Dr. P Ferrari
Research questions
Part 1: Motion perception (fast & slow moving dots)
- Is there different cortical representation for fast & slow motion?
- Are there different temporal dynamics for fast & slow motion?
Part 2: Decision-making
- Subjects need to detect a change in the motion velocity and respond with button press
- When and where in the brain is a visual perception (velocity change) transformed into the neural signals for action?
Experiment
- Prior to the imaging sessions, I conducted a perceptual thresholds test (N=22) to acquire the minimal detectable increase and decrease in motion velocity for the subjects
- I set up the experimental environment and collected MEG & MRI data (N=12) with the helps from S. Bells and M. Lalancette at Toronto Sickkids hospital.
- Velocity change in the experiment was set according to each subject's perceptual thresholds, so the correct and incorrect responses could be compared
- A delayed motor response paradigm was used to separate decision-making signals from motor related signals.

Analyses

Results
Part 1 - Motion Perception
No difference in the MT+ locations (Talairach) for fast and slow motion was found (Hotelling's T2 for two multivariate independent samples)
Fig - MT+ locationsFig - comparing the MT+ locations with previous studies
No temporal dynamics for source peak amplitude and latency found
- Velocity and visual display had no effects (3-way ANOVA)
- The amplitude and latency btw the three ROIs were different (P<.05)
- Multiple-comparison showed cuneus had higher amplitude & earlier latency than V3A & MT+

Part 2 - Decision-making
Comparing the grand average event-related beamformer images:
- In the correct responses, the frontoparietal sources were observed at various time points after the velocity change onset (left column, perm-test, P<.05)
- No significant frontoparietal activations were observed in the incorrect responses (right column)

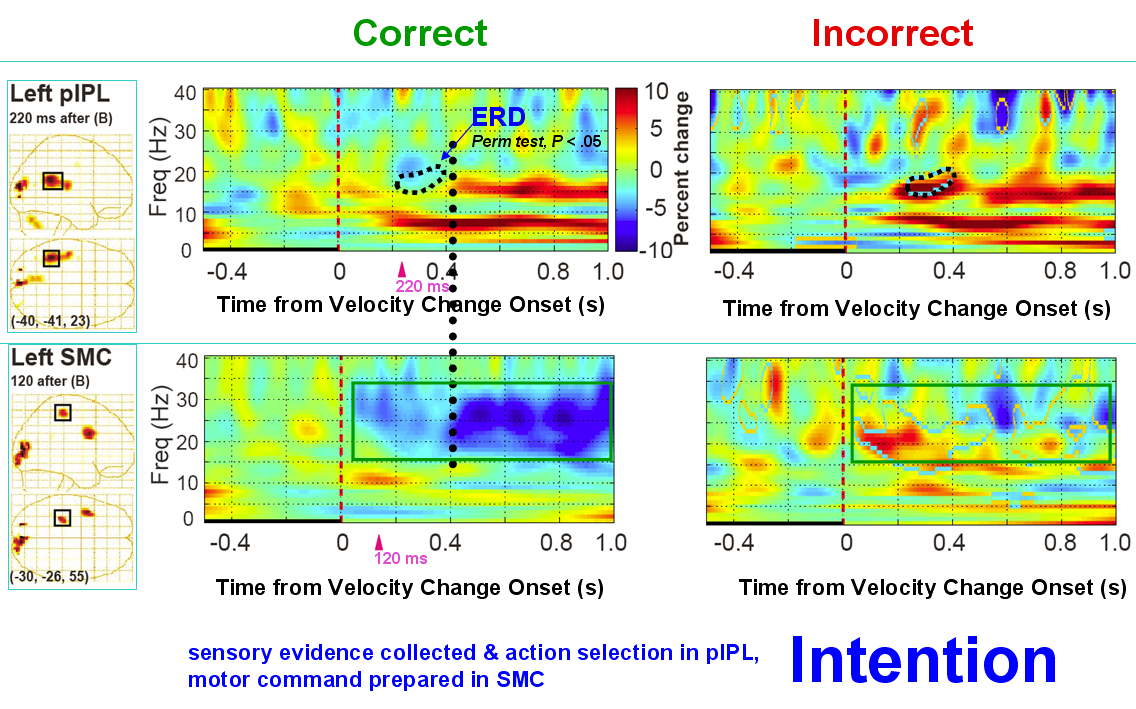
Comparing the time-frequency plots for correct and incorrect responses from IPL and SMC sources:
- IPL source showed a beta power difference between correct and incorrect responses from 200 - 400 ms (area encircled in dotted line)
- The initiation of IPL beta ERS was aligned with the high beta ERD increase in SMC after 400 ms (dotted line)